The Majority Illusion
How 12% Can Look Like Everyone
Marcelo Katogui
February 24, 2026
The Premise
You open social media. Most people around you seem to hold a particular opinion, adopt a new trend, or engage in a specific behavior. You conclude:
“This must be what most people think.”
You are almost certainly wrong.
This document demonstrates — with simulation — how a 12% minority can appear to be the norm when its members occupy structurally central positions in a network. The mechanism is well-established: it is a consequence of the Friendship Paradox (Feld, 1991) and the Majority Illusion (Lerman, Yan & Wu, 2016).
What follows is a computational demonstration of the effect, its magnitude, and its statistical significance.
1. The Network and Its Inequality
We generate a scale-free network of 500 nodes using the Barabási–Albert preferential attachment model. Each new node connects to 3 existing nodes, with a preference for nodes that already have many connections — the rich get richer.
This produces a topology where most nodes have few connections and a small number of hubs have disproportionately many. This structure is observed in online social networks, citation graphs, and biological systems.
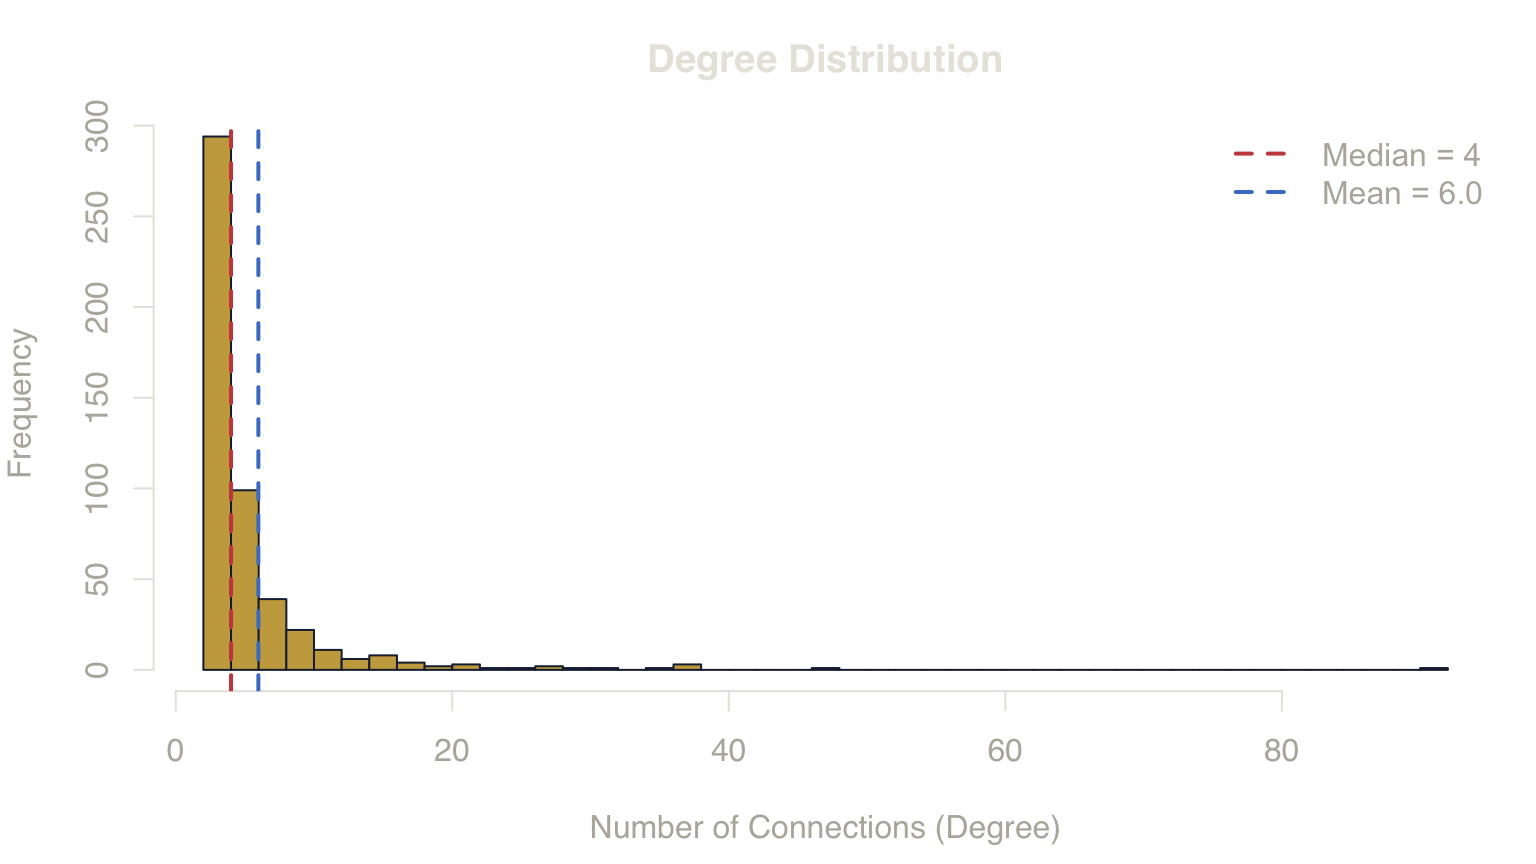
Notice the fat right tail. Most nodes have 4 or fewer connections, but a handful have 30–60+. These hubs are structurally central: they appear in the neighborhoods of many other nodes. That asymmetry is the source of everything that follows.
2. Why Hubs Distort Perception
Before we show any results, we need to understand why hubs produce distortion. The answer is a mathematical certainty, not a simulation artifact.
The Friendship Paradox (Feld, 1991)
For any undirected graph \(G = (V, E)\), the mean degree of a node’s neighbors is greater than or equal to the mean degree of the nodes themselves:
\[\frac{1}{|E|} \sum_{(i,j) \in E} d_j \;\geq\; \frac{1}{|V|} \sum_{i \in V} d_i\]
with equality only when all degrees are identical (i.e., degree variance is zero).
Corollary (Majority Illusion — Lerman et al., 2016): Any trait positively correlated with degree will be overrepresented in local neighborhoods relative to its true global prevalence.
In plain language: high-degree nodes appear in more people’s neighborhoods by definition. If these high-degree nodes carry a trait — an opinion, a behavior, a product — then that trait will be visible to a disproportionate number of observers. Each observer samples their local neighborhood and concludes the trait is common. Globally, it is not.
This is not a statistical anomaly. It is a structural theorem. It holds for every network with non-zero degree variance.
3. Activate the Minority
We select the top 12% most connected nodes and label them “active.” This models any scenario where a behavior or trait is concentrated among highly visible individuals — influencers, power users, vocal partisans.
Ground truth: Exactly 12% of nodes are active (60 out of 500).
This is the number that every node should perceive if their local sample were unbiased.
Note: this setup assumes perfect correlation between degree and trait presence (we activate the top-k by degree). Real-world correlations are partial, which reduces the effect. The results below represent an upper bound for a given prevalence level.
4. What Each Node Actually Sees
For every node \(i\), we compute its local perception: the fraction of its neighbors that are active.
\[\hat{p}_i = \frac{\sum_{j \in \mathcal{N}(i)} \mathbf{1}[\text{active}_j]}{\deg(i)}\]
If perception were unbiased, \(\hat{p}_i\) would cluster around the global rate of 12%.
40.8%
Average perceived prevalence — a 3.4x overestimate of the true 12%.
5. Seeing the Illusion
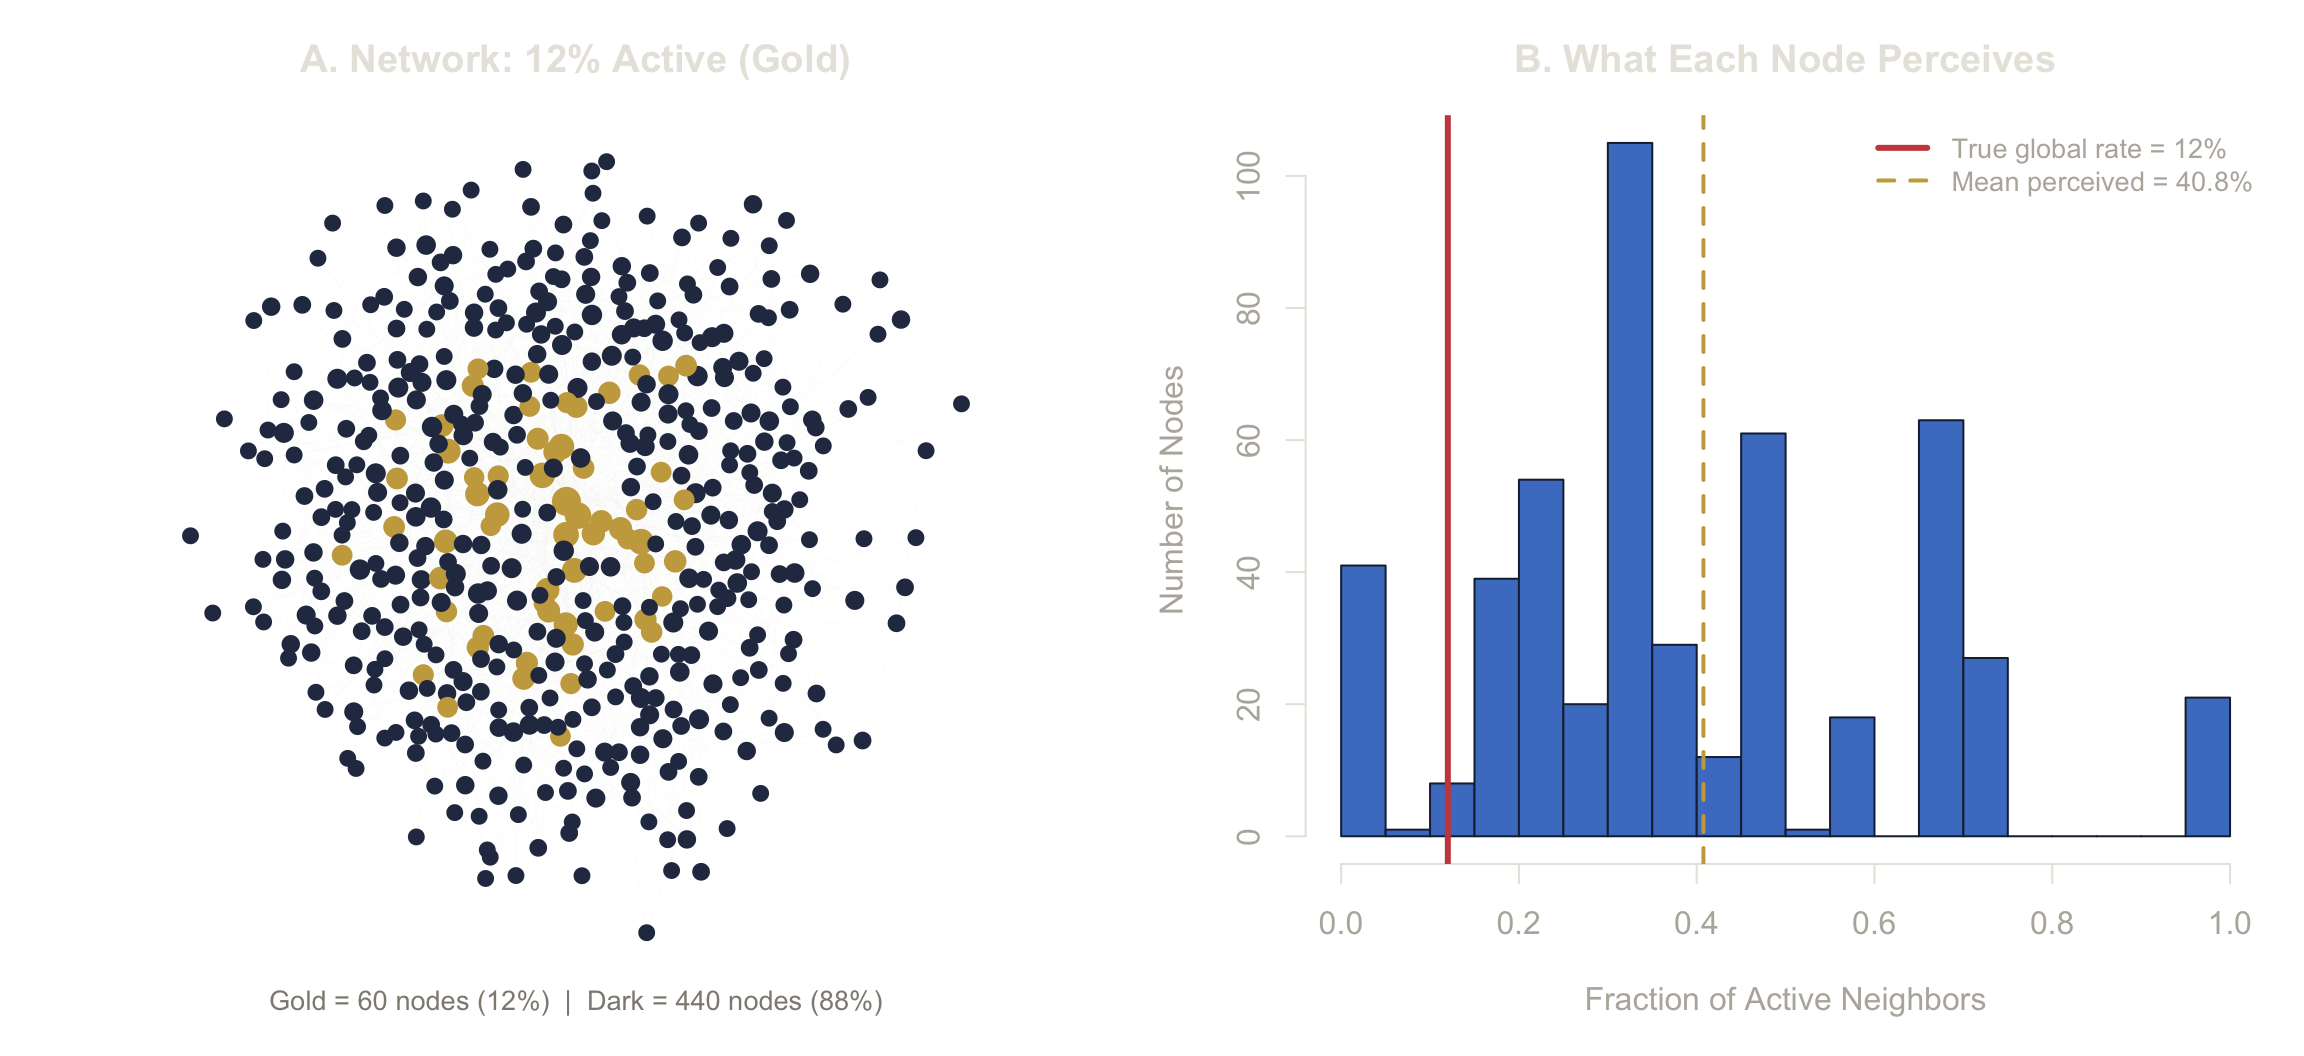
Panel A: Count the gold dots — 60. They are 12% of the network. Notice where they sit: not at the periphery, but in the dense center, connected to everything.
Panel B: The red line marks the true rate (12%). The histogram shows what nodes actually experience. The typical node’s local perception diverges sharply from reality — most observe 30–50% active neighbors.
The positional advantage of hubs converts a 12% minority into a perceived 40% norm.
6. Structure vs. Randomness
Is this distortion caused by which nodes are active (hubs), or would any 12% produce it?
We run a Monte Carlo null test: activate 12% of nodes at random (ignoring degree), 1,000 times, and compute the illusion rate each time.
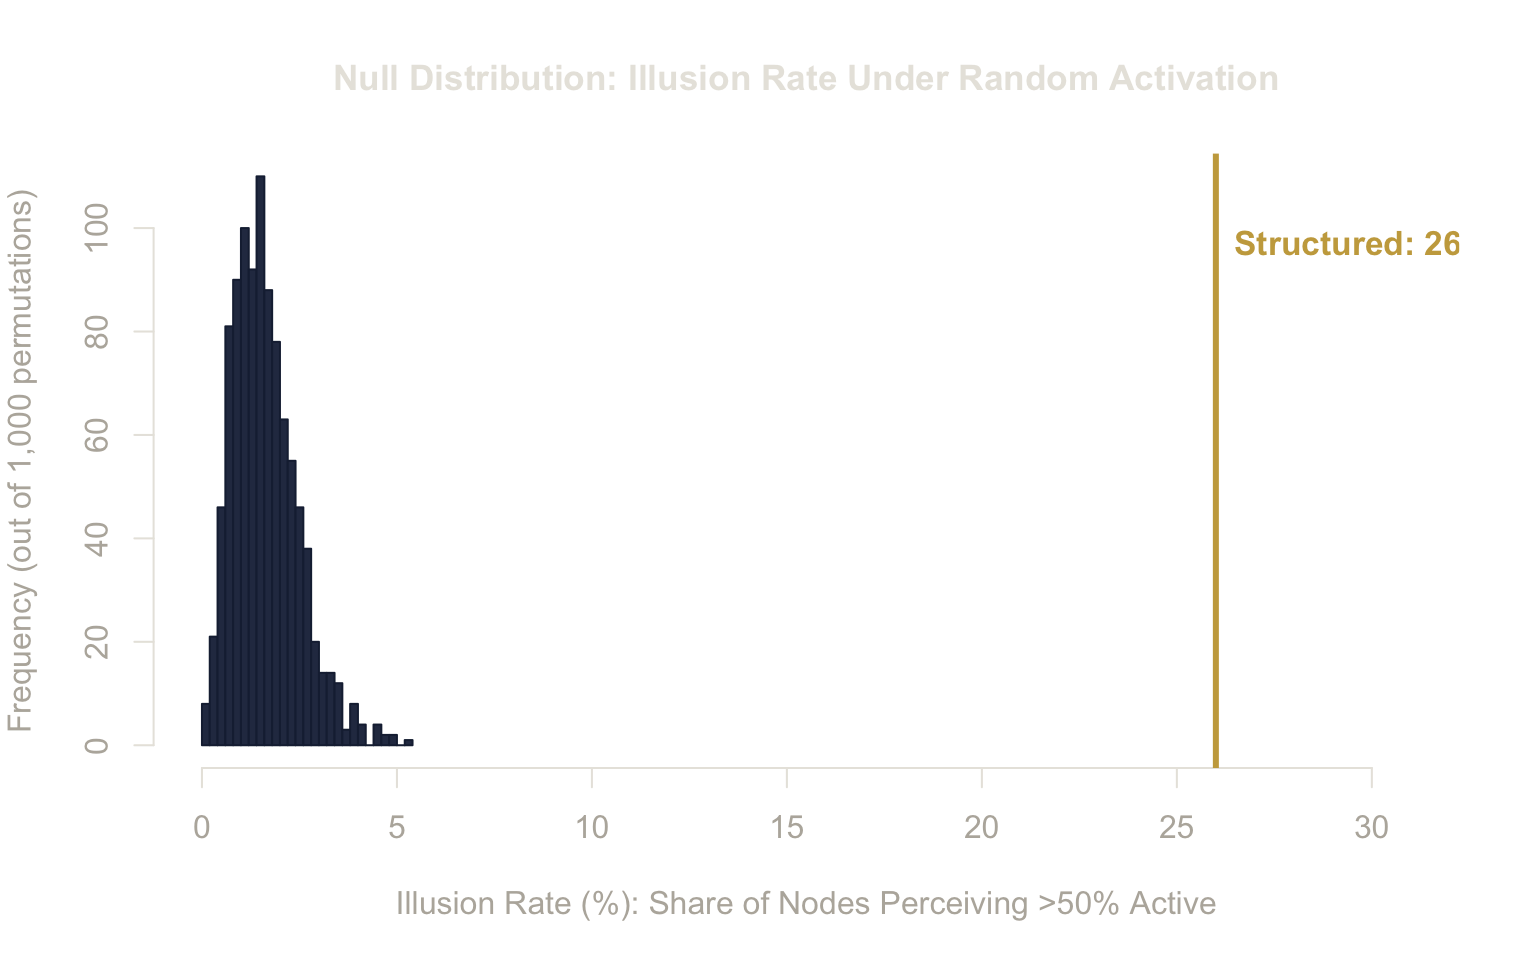
Result:
- Structured activation (hubs active): 26.0% of nodes perceive a majority.
- Random activation (null): 1.7% +/- 0.8%
- p-value: 0.0000 (none of 1,000 random draws reached the structured value)
The structured illusion rate is 15x the null expectation. Structure is the cause, not chance.
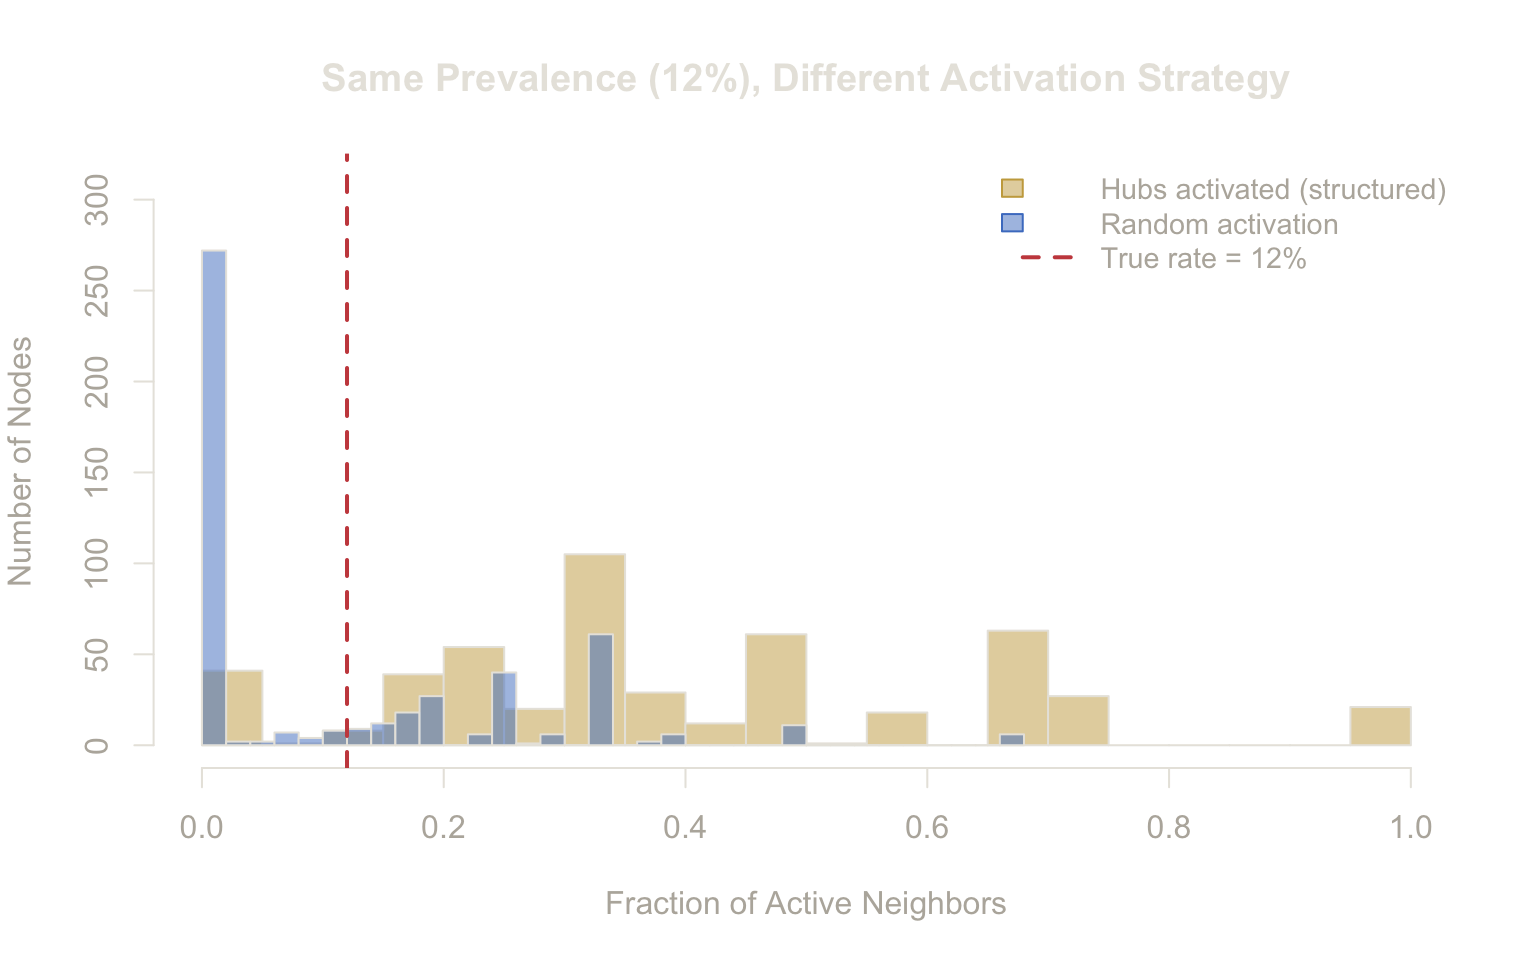
Blue (random): perception clusters tightly around 12%. Local experience tracks global reality.
Gold (structured): perception spreads across 0–80%. The center of mass shifts to ~40%. The illusion emerges entirely from which nodes carry the trait.
7. The Illusion Gap
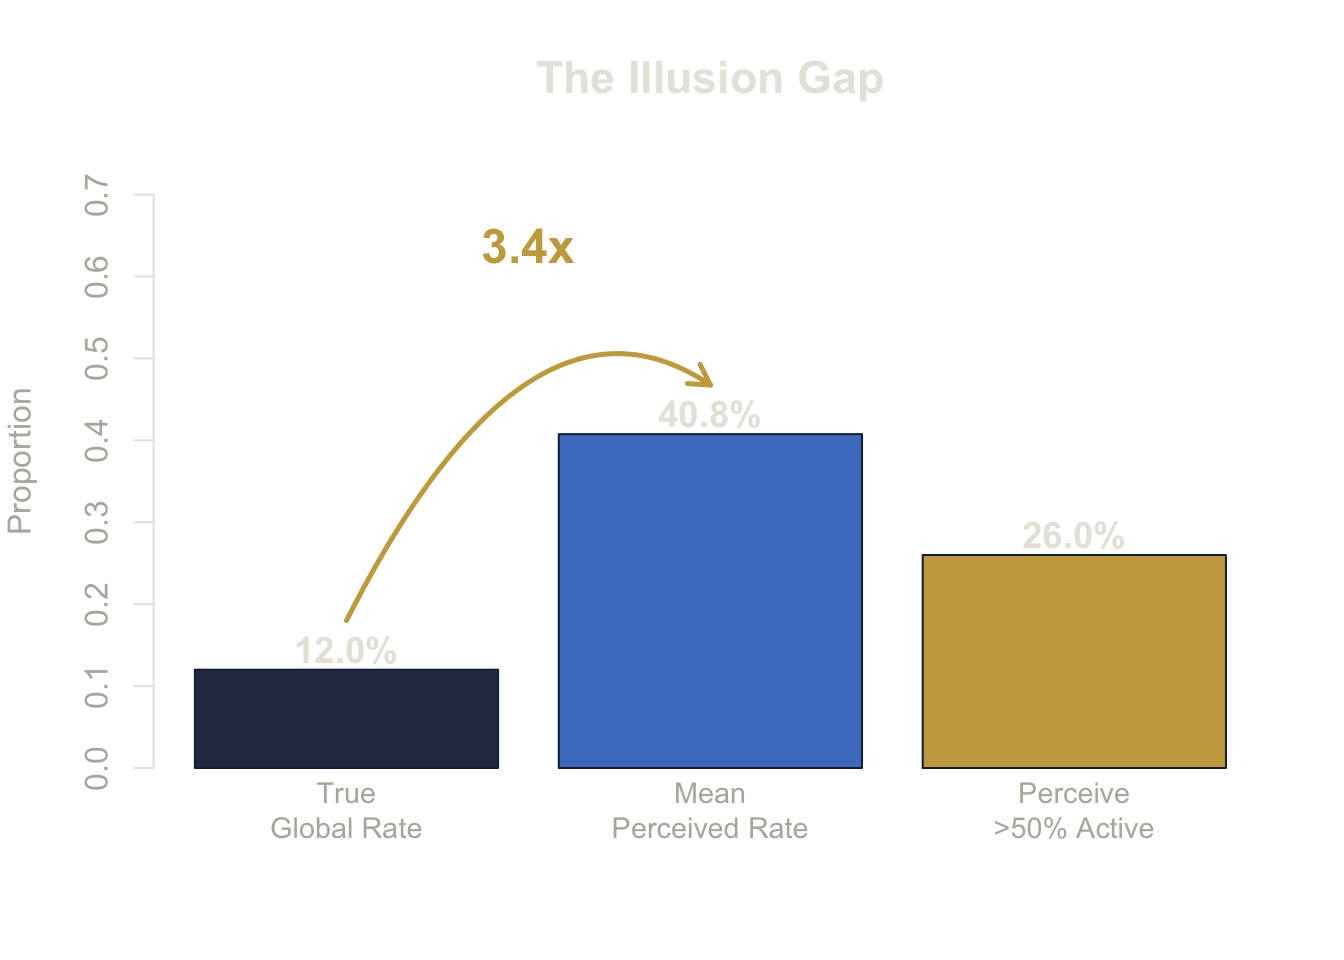
| Metric | Value | Unit | Meaning |
|---|---|---|---|
| True global rate | 12.0% | fraction active | Actual share of active nodes |
| Mean perceived rate | 40.8% | fraction active | Average of all nodes’ local perceptions |
| Illusion rate | 26.0% | fraction of nodes | Share who see a majority of active neighbors |
Bars 1 and 2 are directly comparable — both measure fraction active (globally vs. locally averaged). The 3.4x gap is the perception bias.
Bar 3 measures the share of nodes crossing the 50% threshold. It is a consequence of the bias: over 1 in 4 nodes would conclude the behavior is dominant.
8. Sensitivity Analysis
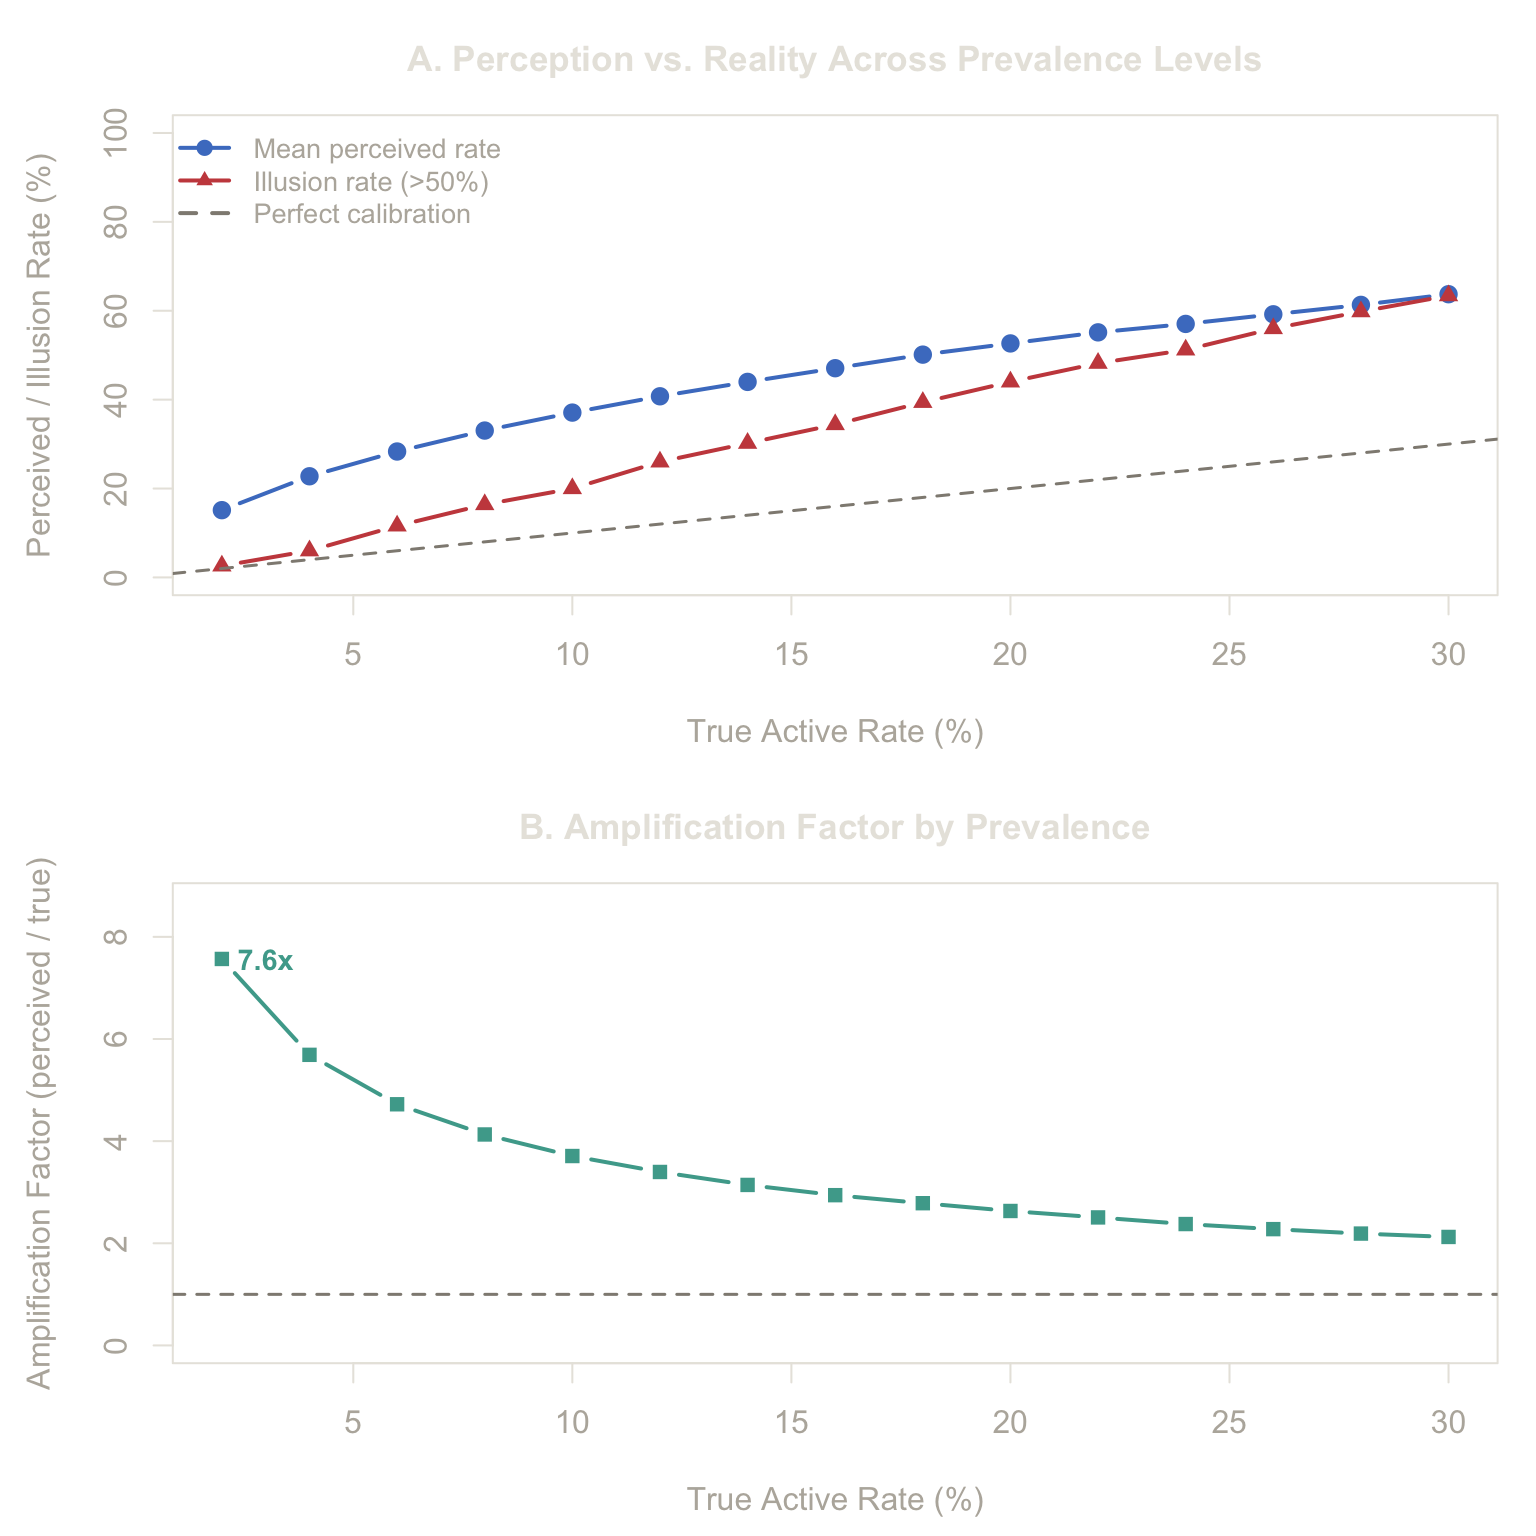
Three observations:
-
Amplification is strongest at low prevalence. At 2% true rate, the perceived rate is 8x higher.
-
Amplification decays as the active rate increases — because marginal recruits are lower-degree nodes that contribute less bias.
-
The illusion rate (red, Panel A) crossing 50% means a majority of the network perceives the minority as dominant.
9. Real-World Consequences
| Domain | Who are the hubs? | What gets amplified |
|---|---|---|
| Social media | High-follower accounts, viral sharers | A niche opinion appears mainstream |
| Health behaviors | Heavy drinkers are more socially active | Students overestimate peer alcohol use |
| Political polarization | Extreme voices post more frequently | Moderates believe extremism is the norm |
| Technology adoption | Early adopters are network hubs | A product appears ubiquitous before it is |
| Academic citation | Highly cited papers appear in more bibliographies | A subfield’s importance is overestimated |
The scaling implication: in networks with power-law degree distributions and strong degree–trait correlation, a 5% minority can appear dominant to over 40% of the population.
10. Limitations
This simulation is a controlled demonstration, not a model of any specific real system. Five constraints bound the generalization:
-
Perfect degree–trait correlation. We activated the top-k nodes by degree — a ceiling on the effect. Real-world correlations are partial, reducing the distortion.
-
No clustering. BA graphs have near-zero transitivity. Real social networks have clustering coefficients of 0.1–0.6.
-
No community structure. Real networks are modular. The illusion may be concentrated within certain communities and absent in others.
-
No degree correlation (assortativity). BA graphs are approximately uncorrelated. Real social networks tend to be assortative, which could further amplify the effect.
-
Single realization. One graph (n=500, seed=42). The reported metrics are point estimates with unknown variance.
Summary
| Metric | Value |
|---|---|
| Nodes | 500 |
| Edges | 1494 |
| Active nodes | 60 |
| True global rate | 12.0% |
| Mean perceived rate | 40.8% |
| Amplification factor | 3.4x |
| Illusion rate (>50%) | 26.0% |
| Null illusion rate (random) | 1.7% +/- 0.8% |
| p-value (structured vs. null) | 0.0000 |
A 12% minority, placed on network hubs, is perceived as 41% prevalent on average. 26% of the population sees them as the majority.
The structure of the network — not the size of the group — determines its perceived dominance.
References
- Feld, S. L. (1991). Why your friends have more friends than you do. American Journal of Sociology, 96(6), 1464–1477.
- Barabási, A.-L., & Albert, R. (1999). Emergence of scaling in random networks. Science, 286(5439), 509–512.
- Lerman, K., Yan, X., & Wu, X.-Z. (2016). The “Majority Illusion” in social networks. PLOS ONE, 11(2), e0147617.
- Alipourfard, N., Nettasinghe, B., Abeliuk, A., Krishnamurthy, V., & Lerman, K. (2020). Friendship paradox biases perceptions in directed networks. Nature Communications, 11, 707.