The Difference Between a Report and a Decision Tool
The Decision Stack · Post 2 of 10
Marcelo Katogui
March 04, 2026
The Decision Stack · Post 2 of 10
A series on the architecture, methods, and mindsets behind building analytical systems that actually drive decisions.
1. The Terms Are Not Interchangeable
The terms are often used interchangeably. They should not be.
A report is a structured description of what happened. It answers questions like: how much did we sell, where did costs increase, what did our users do last month. Reports are backward-looking by design. They are valuable for understanding context, documenting performance, and maintaining organizational memory. Most analytics output in most organizations is reports.
A decision tool is something different. It is built around a forward-looking question: given what we know, what should we do? Decision tools are not just descriptive — they encode tradeoffs, surface optionality, and make the cost of alternative choices legible.
2. Four Structural Dimensions
The structural difference shows up clearly in four dimensions.
Time Orientation
Reports document the past. Decision tools model the future, at minimum in the form of projections, and ideally in the form of scenario simulation. A well-designed decision tool does not just tell you where you are — it shows you where you are likely to end up under different courses of action.
User Interaction
Reports are consumed passively. You read them. Decision tools are operated. The user adjusts inputs — budget, timing, assumptions, constraints — and the system responds. The interaction is part of the value.
Embedded Logic
Reports present data. Decision tools embed logic: rules, models, optimization criteria, thresholds. This is where analytical depth actually lives. The model is not an exhibit in the report. It is the engine of the tool.
Accountability Structure
Reports are distributed broadly. Decision tools are built around specific decision-makers with specific responsibilities. A tool designed for a procurement officer and a tool designed for a portfolio manager might draw on the same underlying data, but they should be organized around entirely different choices.
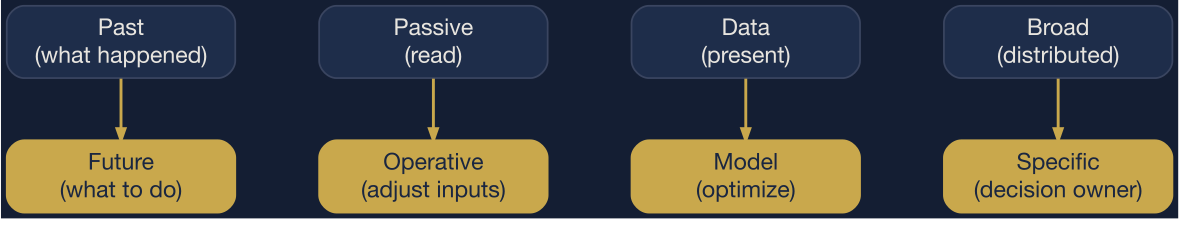
Four structural dimensions that separate a report from a decision tool. A system that scores left on all four is a report, regardless of its interface.
3. The Dashboard Trap
The Blurred Line. In practice, the line between the two is often blurred because organizations build dashboards that look like decision tools but are structured like reports. They add filters and visualizations, but the core logic remains descriptive. Users can see more, navigate more — but they still cannot simulate, optimize, or stress-test.
This is the most common failure mode. A dashboard that lets a user filter sales by region and quarter feels interactive, but if it does not answer the question “what should we do differently next quarter, and at what cost?”, it is still a report wearing a decision tool’s interface. The interactivity creates an illusion of decision support without providing the underlying logic that would make it real.
4. The Practical Test
The Test. After a user interacts with the system, are they better equipped to make a specific decision? If the answer requires more meetings, more manual analysis, or more guesswork, the system is still a report.
Building actual decision tools requires a different starting point: not the data, but the choice architecture. What is the decision? What are the alternatives? What are the relevant constraints? What model would a rigorous analyst use to evaluate the options? That model becomes the engine. The interface becomes the cockpit.
Choice Architecture. The structure of alternatives, constraints, and evaluation criteria that defines the decision space. A decision tool is an operationalization of a choice architecture. A report is not.
A simple diagnostic score captures whether a system has crossed the line from report to decision tool:
\[ S = T + I + L + A \]
where each dimension scores 0 (report-like) or 1 (decision-tool-like): \(T\) for time orientation (forward-looking), \(I\) for interaction (user-adjustable inputs), \(L\) for logic (embedded model or optimization), and \(A\) for accountability (built around a specific decision owner). A system scoring \(S \leq 1\) is a report. A system scoring \(S \geq 3\) is a decision tool. The systems in the middle are dashboards — and most dashboards live there permanently.
The distinction between reports and decision tools is not a taxonomy for its own sake. It is a diagnostic. Most organizations that believe they have invested in decision support have, in practice, invested in reporting infrastructure. Recognizing the difference is the first step toward building something that changes how choices actually get made.
Design Principle
This shift in framing is not cosmetic. It changes what gets built, how it gets used, and what value it delivers.
5. Codified Rules
The four dimensions produce four binary gates. A system that fails any gate is a report, regardless of how interactive it looks.
| Gate | Condition | Action |
|---|---|---|
| G1 | No forward-looking output (projections, scenarios, or simulations) | → Add a model. Description without projection is reporting. |
| G2 | User cannot adjust inputs or assumptions | → Build interaction. Read-only systems are reports by definition. |
| G3 | No embedded decision logic (rules, optimization, thresholds) | → Encode the tradeoff. Data without logic is an exhibit, not an engine. |
| G4 | No identified decision owner or decision cadence < 1 per month | → Assign accountability. Tools without owners become dashboards. |
A system scoring \(S \leq 1\) on these dimensions should not be called a decision tool. Calling it one creates an illusion of decision support that delays the investment in building the real thing.
References
- Howard, R. A. (1966). Decision Analysis: Applied Decision Theory. Proceedings of the Fourth International Conference on Operational Research, 55–71.
- Kahneman, D. (2011). Thinking, Fast and Slow. Farrar, Straus and Giroux.
- Few, S. (2009). Now You See It: Simple Visualization Techniques for Quantitative Analysis. Analytics Press.
- Power, D. J. (2002). Decision Support Systems: Concepts and Resources for Managers. Quorum Books.
- Raiffa, H. (1968). Decision Analysis: Introductory Lectures on Choices Under Uncertainty. Addison-Wesley.
- Shmueli, G. (2010). To Explain or to Predict? Statistical Science, 25(3), 289–310.